
- SMT is on a crucial support level level of 690 and has a huge potential downside if slumps.
- Stock has been falling sharply since the start of August making the investors panic.
- Increased revenue but a decreased profit margin in the last quarter is another reason to worry.
A global investor into all sorts of businesses, SMT or scottish mortgage investment trust is an investment giant based out of Edinburg, UK. The company has a long history beginning in the early 1900s of how it became such a huge investment firm and is today a part of the FTSE 100 index.
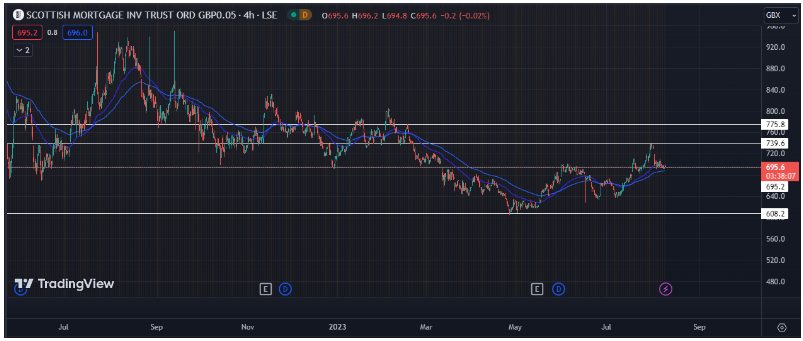
Technical Analysis for the stock-
The stock over the years has generated great returns for the investors but 2023 has been a little negative for the company. Decreased profits in the last quarter in a big reason why the stock has not given the expected returns.
Currently, the stock trades near a very crucial support at 690 dollar levels and if this level is breached, we might see another breakout till 660 pound levels. Stock has been bearish since the beginning of this months and buyers have been out.
Technical indicators currently give a mixed signal due to which a confusion has ben created for the investors.
If there is a possible upside move from the current levels, 720 pounds is the immediate next support and only if the stock breaches this level, one must look to enter long.
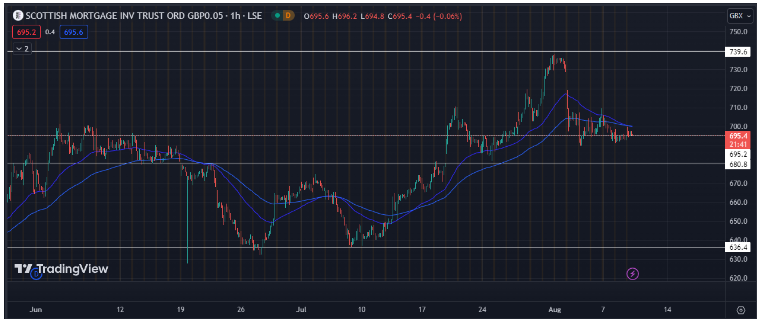
On a smaller time frame, we see higher selling volumes than buying ones and the stock struggling to maintain its current support. Prominent indicators like 50 and 100 EMA suggest a possible downside.
Talking of the possible targets, the upcoming months might see a more downside in the stock with 680 being a soft support. If this level is breached, we might see sharp selling as the next strong support is at 636 pounds.
Upside targets are currently at 710 followed by 720 dollars.
Conclusion:
Currently, the stock looks bearish. Charts and indicators both suggest a possible downside. One should keep a close eye as a trader as there are good downside targets. People willing to enter long, the next 10-15 days will be crucial and only if the stock shows healthy buying volumes, one must enter.
Major technical levels-
Major support levels- 680 followed by 636 pounds
Major resistance levels- 720 followed by 740 pounds.