
- Ethereum (ETH) is currently trading at $1874.66.
- Ethereum (ETH)’s market cap is $225,311,285,903.
- Ethereum (ETH)’s return on investment (ROI) is 66107.97%.
Introduction
Ethereum is a blockchain platform that creates a peer-to-peer network that executes and verifies the application code securely. Smart contracts and decentralised apps (DApps) can be created on the Ethereum decentralised blockchain platform. It was introduced in 2015 after being proposed by Vitalik Buterin in 2013. By enabling developers to build and deploy their apps on its network, Ethereum pioneered the idea of a programmable blockchain.
Ethereum’s native cryptocurrency, Ether (ETH), is used as the network’s primary medium of exchange. A few of the functions of ether include paying transaction fees, taking part in decentralized finance (DeFi) protocols, and rewarding network validators. The capability for smart contracts is one of Ethereum’s core characteristics. Self-executing contracts, or “smart contracts,” are written in code and go into effect when certain criteria are met.
Trend Analysis
Since its introduction, Ethereum’s price has significantly increased over the long run. Similar to Bitcoin and other cryptocurrencies, the price of ETH has been through numerous ups and downs. Despite these variations, the overall long-term trend has been upward. Recently, ETH has given a breakout from a triangle pattern with a very good volume.
The price of Ethereum (ETH) has increased by 18.92% during the last 10 days, showing that it is now outperforming. Ethereum (ETH) reached a peak of $4951.83 in less than eight months. Since then, it has lost -82.70% of its value and gained approximately 50% from the swing low. The rise in buying volume may be the cause of Ethereum’s (ETH) superior performance.
Ethereum (ETH) Price Analysis
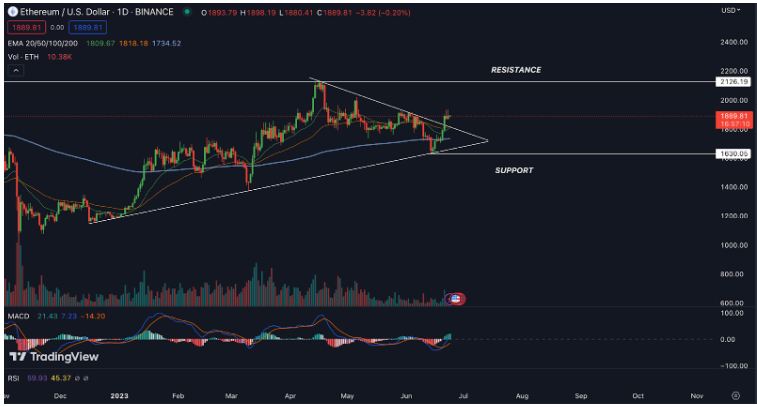
EMA: ETH is currently trading above both the 20-day and 50-day exponential moving averages in the daily time frame, which is a positive sign. Buy-side sentiment among investors and bullish momentum are concentrated on Ethereum (ETH).
MACD: The MACD line for Ethereum (ETH) in the daily timeframe is currently above the signal line as of the most recent data. The signal line is at -10.08 and the MACD line is at 9.03, one of them is above the zero line indicating a change in trend from downward to upward may happen. It suggests that Ethereum (ETH) may be moving in an upward trend.
Volume Analysis: The Ethereum (ETH) 24-hour volume is $8,317,861,108 which rises by 19.36% in 24 hours, indicating an increase in market activity in the current state.
Technical Levels
Support – The current support level of the Ethereum (ETH) is $1630.05.
Resistance -The current resistance level of the Ethereum (ETH) is $2126.19.
Conclusion
In conclusion, the analysis of the MACD and EMA in the daily period indicates that Ethereum (ETH) is now showing positive signs. The EMA is below the price and crossing the 20-50 EMA has indicated a favourable outcome, the MACD indicates buying pressure. Overall sentiments are positive, there is a presence of buyers in the market.
Disclaimer
The views and opinions of the author, or anyone named in this article, are for informational purposes only. They do not offer financial, investment, or other advice. Investing or trading crypto assets involves the risk of financial loss