
- Price has declined over 64% from its high ($91.63) created on 18 April 2023.
- Price has melted down 2.36% in a week, 17.63% in a month and 20.07% in a year.
- Price is trading below both the important EMAs i.e. 50 and 100.
Market capital of GMX coin – $293.34 million
The current market price of GMX coin – $32.64
GMX price in the current session is up by $0.98(3.1%) and the price is forming a bullish marubozu candle near the support level which is a good sign for the bulls. Although the price is in a strong bearish trend as the price has declined over 2.36% in a week, 17.36% in a month and 20.07% in a year which means the overall trend of the coin is down.
The price has declined over 64% from the highs which means the buyers suffered a lot in this counter over the last 3-4 months. The coin is continuously falling and eliminates the buyers at every level. The price formed big red candles when it was falling but if we look now it is forming small green candles which indicates that the buyers need to be more aggressive.
Technical Analysis of GMX Coin:
The price formed a big red candle on 17th August where the price declined over 29% in a day session but till the close of the daily candle, the price recovered from the low and closed the day with -10.83 %. Since then the price has been unable to cross that range created by that candle on either side.
On a daily time frame, the price is trading below both the important EMAs i.e. 50 and 100 which is present near the level of $39.10 and $45.43. The slope of the EMA is steep downward which indicates that there is a very strong selling pressure at the current in the coin and it will be very difficult for the stock to rise.
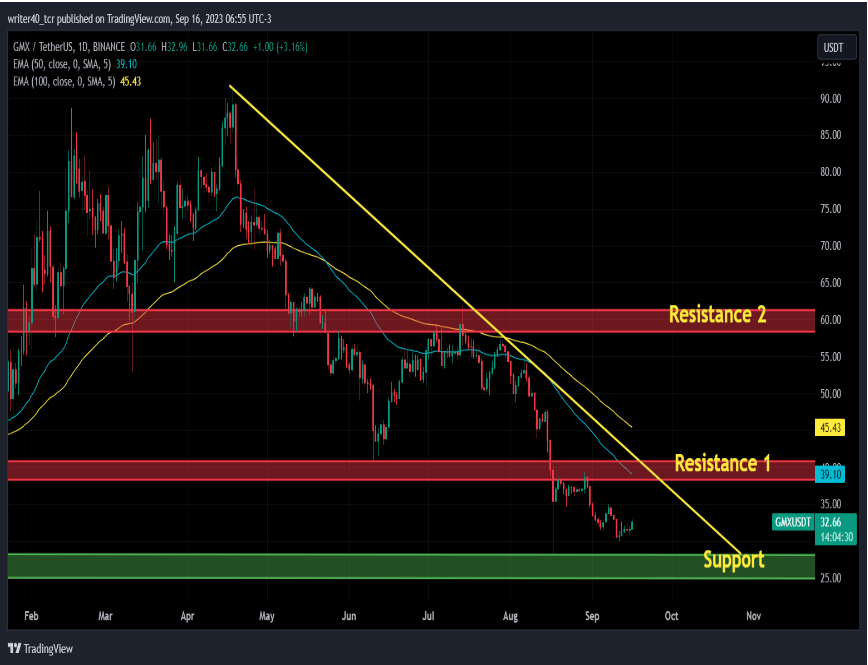
The coin has created some important levels for both sides i.e. demand and supply levels. If we observe in the chart the price has formed two resistance points, 1 is near $39 – $41 which is drawn as resistance 1. And if the price breaches this level then the second resistance level is placed near the $58-$60.
If we talk about the support level then the price has created support near the $25-$28 level. The price is falling with the support of downward sloping trendline which will be the crucial hurdle to cross for the price. Along with it, EMAs will also act as a resistance point which will push the price down.
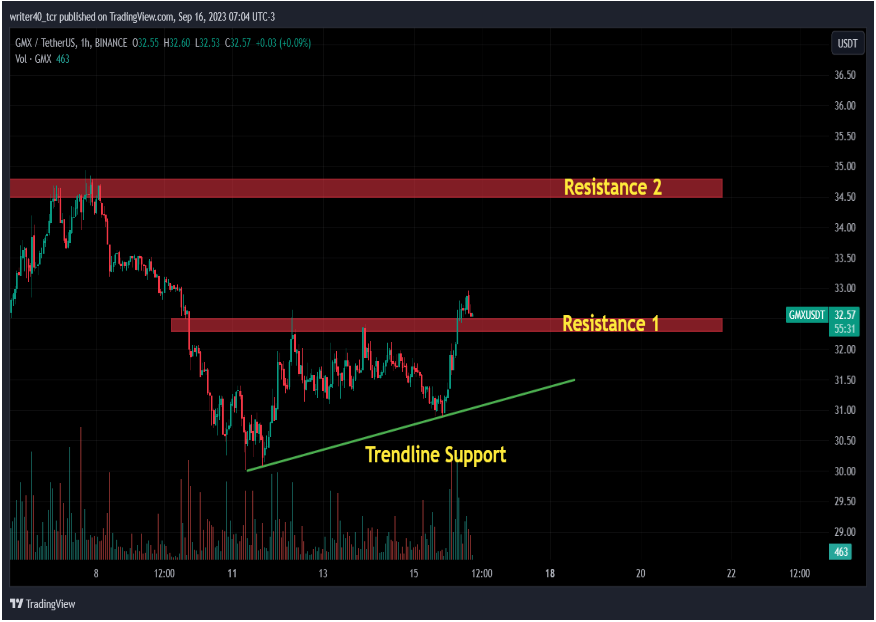
On the hourly time frame, the price has broken the ascending triangle pattern and is currently trading above that. The price is now testing the previous resistance level as it is drawn on the chart. The next resistance level is near the price of $34.50- $34.80 which will act as a hurdle for the coin. The rising trendline will act as support for the price.
Conclusion
The price has recently broken the ascending triangle pattern and is taking support from the previous resistance level. If the price crosses the recent swing high of $33 then we can see some good up move. If the price breaks the level on the downside then we can expect some bounce from the rising trendline support.
Technical Level:
Resistance- $34.5 – $39.5
Support- $31 and $25.5
Disclaimer
The analysis is done for providing information through technical analysis and no investment suggestions are given in the article to be made by investors. The coins are unpredictable so investors should have proper knowledge. Cryptocurrencies are highly volatile and risky. Investment should be made with proper technical analysis.