

GNOSIS is trading at $116. The price is down 1.34% in the last 24H. The 24H trading volume saw a fall of 22%. The Total Market Cap is $301,112,720.
- GNO/USDT saw a weekly return of 7.81%
- GNO/USDT recorded Year To Date performance of 39.59%
GNOSIS is stuck in a consolidating market since the beginning of the year. The price recovered from its all-time in January but hasn’t been able to escape $123. This sideways price action is testing the patience of some investors while serving as a profitable environment for scalpers and short-term traders.
The Price is trapped in a consolidation phase,
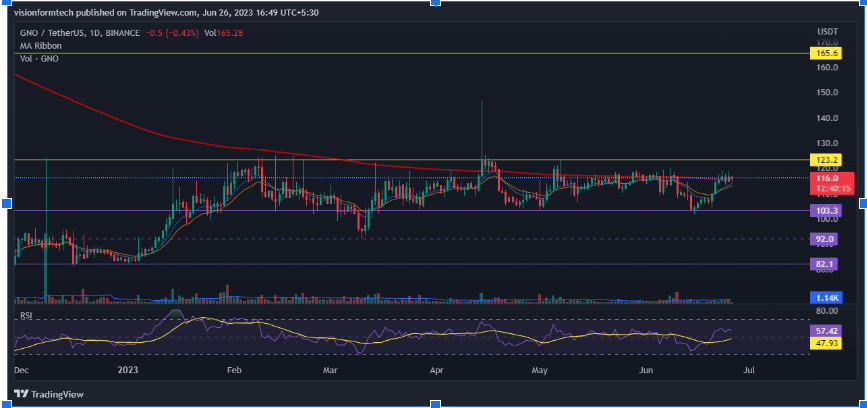
Source: GNO/USDT by TradingView: https://www.tradingview.com/x/uPDqp274/
As seen on the Daily Chart, the price appears to be bouncing between the level of $123 and $103. The price briefly escaped the consolidation zone while making a short trip down to the price of $93. GNO quickly recovered from this downfall back into the sideways action.
On the 14th of April, a similar attempt was made by the Bulls which spiked the price to $146. Many buyers got trapped as the price was forced down instantly. The consolidation will not last forever and volatility can be just around the corner. A break will result in a very big move and the investors are keeping a watch.
The price is struggling to break resistance.
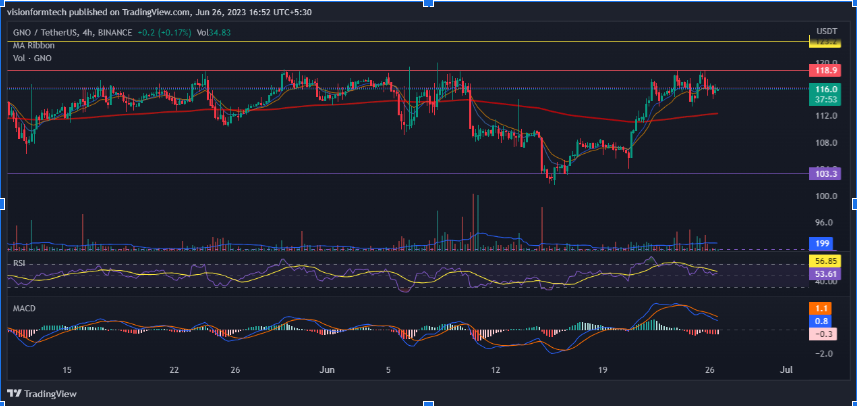 Source: GNO/USDT by TradingView: https://www.tradingview.com/x/fNIZRAp4/
On the 4H, the price action is being enjoyed by short-term traders and scalpers. As the market is range bound, the price respects the resistance and support levels and provides the opportunity of high probability trades. GNO is constantly attacking the resistance while making it weaker.
Since the price is testing the resistance multiple times, it increases the probability of a breakout to the upside. The bears can get tired of selling and losing their stop losses. It may build psychological pressure and the market can shift towards buying. Either way, a big move is expected and volatility can get extreme.
RSI: The RSI indicator is currently at 54.39 on the 4H . This indicates a bullish to sideways market.
MACD: The MACD indicator has made a bearish crossover but the indicator is above 0.
The market will stay more biased towards the bullish side as long as the indicator is above the 0 line but can expect some consolidation or correction.
200 EMA: As observed, on the 4hr, the price is trading above the 200 EMA(exponential moving average) which acts as a significant support. This is a clear indication of an uptrend where the buyers are in control and for a trend reversal, the price must break and trade below. the 200 EMA.
Technical levels
Support Levels: $103 – Support 1
$92 – Support 2
Current Price: $116
Resistance Levels: $123- Resistance 1
$140 – Resistance 2
Conclusion:
GNOSIS has been trading in a consolidation phase for the past 6 months. The market is trapped in a sideways price action. This is troubling a few investors as there is a lack of momentum. While some short-term traders are enjoying the range-bound market and finding ways to turn some quick profits. What’s certain is the possibility of a big move soon. Investors are closely watching for a breakout of range for a potential big move.
Disclaimer:
The views and opinions stated by the author, or any people named in this article, are for informational purposes only, and they do not establish financial, investment, or other advice. Investing in or trading crypto assets comes with a risk of financial loss.