- Hedera price prediction: HBAR coin’s price has seen a recent uptrend due to a series of positive news.
- HBAR has more than 3 factors supporting its bullish momentum.
- The recent corrections have raised the eyebrows of bulls, and it remains to be seen whether they can make a return.
In February, a significant piece of news brought positive momentum to Hedera investors. The partnership between tech giant Dell Technologies and Hedera was announced, aiming to integrate Hedera’s public ledger technology into Dell’s products and online services. This news led to a rapid price surge from $0.0707 to $0.0857 within a short span of time. Although a correction occurred afterward in the HBAR coin’s price, a series of positive developments in the market contributed to its uptrend.
One of these positive developments involved a project supported by Shinchan Bank, SCB TechX, and other financial institutions. This project successfully utilized Hedera’s blockchain technology to facilitate cross-border remittances using stablecoins. The project achieved real-time foreign exchange rate integration across Thai Baht, NTD, and KRW currencies.
Following this, Hedera introduced new capabilities through JSON-RPC, enhancing developer experiences and providing additional supportive features. These successive positive announcements served as catalysts, boosting bullish sentiment and pushing the price into a secure uptrend.
HBAR Coin Technical Analysis and Prediction
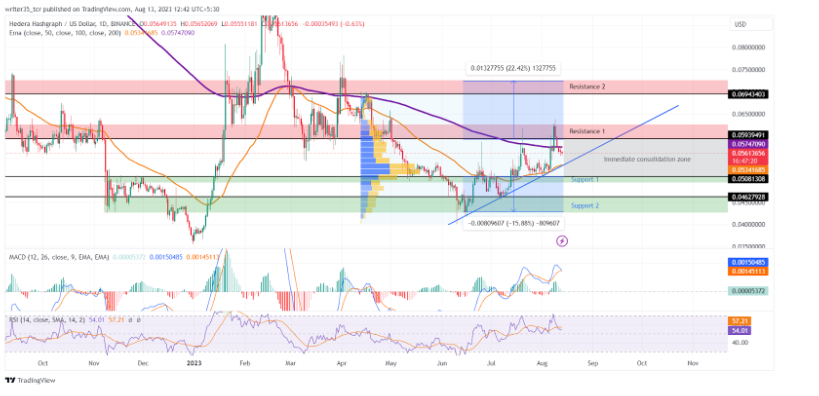
Currently, at the time of writing, the HBAR coin has broken major resistance and is trading at the level of $0.0558 between some supports and resistances, while the indicators are also providing some insights for the near future.
Support: The immediate support is at the level of $.0508, and the 2nd support is at the level of $.0462. These zones have been filled by liquidity as per the last 10 months.
Resistance: The Immediate resistance for HBAR is at the level of $0.059. A deviation was seen recently over this level. The second resistance is at the level of $0.0694.
MACD: The MACD graph is positive as both lines are above zero. The signal line has recently crossed the MACD line which indicates a bullish trend. Right now, both the lines are almost at the same point and looking to make a bearish crossover.
RSI: The RSI line is in neutral territory, but has just crossed its SMA, which may trigger bearish sentiments. RSI is at the level of 53 and its SMA is at 57.
EMAs: The 50 EMA has been supporting bullish momentum, situated below the price level. It played a role in pushing the price upward at the beginning of August 2023. Currently, the 50 EMA at $0.0534 is poised to cross over the 200 EMA at $0.0574, potentially indicating a change in trend direction.
Conclusion
The HBAR price prediction is aligned with the price’s behavior around the trendline on the chart. It appears that the price is currently experiencing a minor correction and may be poised to rebound from the trendline. If the bears continue to dominate, there is the potential for the price to find support at the 50 EMA, which is situated just below the current levels. Additionally, there is an immediate support level in close proximity.
All of these factors collectively contribute to a bullish signal for the HBAR coin’s price. However, in the event that the price breaks below its first support at $0.0508, there is a demand zone from previous months that could act as a support and help bolster the bulls’ efforts for a potential rise in price.
Technicals:
Support: $0.0508, $0.0462
Resistance: $0.0593, $0.0694
RSI: 53
50 EMA: $0.0534
200 EMA: $0.0574
Disclaimer
The views and opinions stated by the author, or any people named in this article, are for informational purposes only. They do not establish financial, investment, or other advice. Investing in or trading crypto assets comes with a risk of financial loss.