

- PEP Stock Price lost 1.03% in one week of trading.
- PEP Stock witnessed a growth of 9.96% in the last one year
PEP Stock Price saw a correction of 8.73% after it created a new all-time high of $196.88 in the month of May 2023. The prices fell steeply down to the daily 200 EMA
Pepsico, INC, Inc. closed the trading session on Tuesday at $186.61. Presently, the PEP Stock is trading at $183.58 which is a 1.20% drop from yesterday.
Saudi Arabia is hosting the world’s biggest esports and gaming festival called Gamers8: The Land of Heroes. PEPSICO was awarded the exclusive contract for serving water, snacks, and beverages.
PEP Stock Price: A lower high is slowing down the bullish momentum
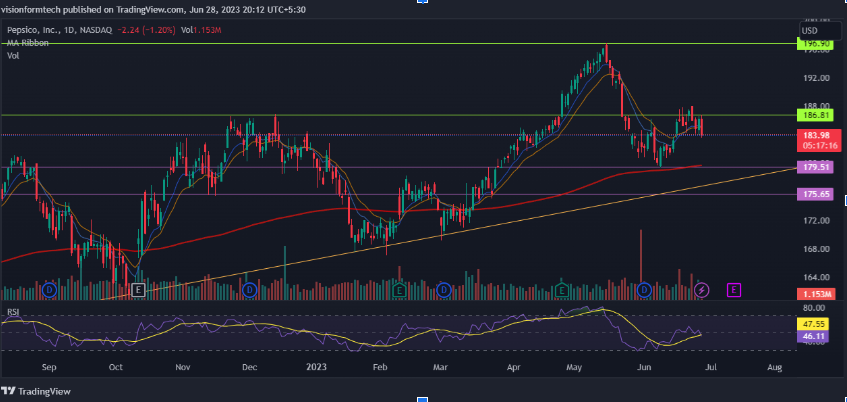
Source: PEP by TradingView:https://www.tradingview.com/x/F3RtgM9i/
The Daily Time frame is suggesting that the PEP Stock is following an uptrend. The price is bouncing on a long-term trendline which plays the role of significant support. The recent correction got a bounce from the 200 EMA. However, the rejection from the resistance of $186.81 is contributing to a lower high.
PEP Stock Price maintains its bullish outlook as long as it is above the trendline. But a lower high is disrupting the bullish market structure and suggesting that the buyers are weak and are not willing to buy at a higher price. The rejection came from the 50% retracement level of the Fibonacci indicator.
Head & Shoulders on the 4H: Technical Indications!
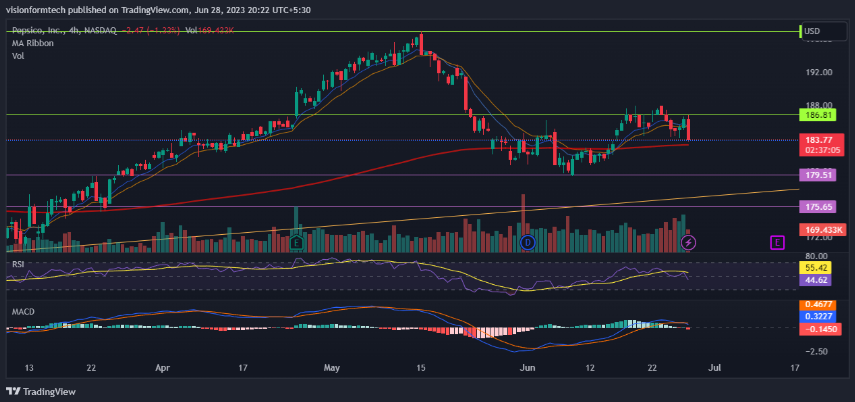
Source: PEP by TradingView:https://www.tradingview.com/x/Eng2rtzG/
Things are looking shaky on the 4H Chart, PEP Stock created a head & shoulder pattern which has a price target of almost 2%. The breakdown of this pattern will dump the price to $180. The Bulls will be looking forward to defending the 200 EMA. If a 4H candle closes below the EMA, It may confirm the breakdown.
The Technical indicators are showing some weakness with the values dropping for RSI and MACD. PEP Stock is expected to extend the consolidation phase in the short term as the market is missing the Buying strength. However, must hold the trendline to make sure the overall bull trend stays intact.
RSI: The RSI indicator is currently at 44.19. It represents a bearish to sideways condition.
MACD: The MACD indicator is Attempting a bearish crossover above the 0 line. This suggests bearish to sideways momentum.
200 EMA: As observed, on the 4hr, the price is trading above the 200 EMA(exponential moving average) which acts as a significant support. This is a clear indication of an uptrend where the buyers are in control and for a trend reversal, the price must break and trade below the 200 EMA.
Summary:
PEP Stock Price saw a correction of 8.73% after it created a new all-time high of $196.88 in the month of May 2023. The Market appears to be in an accumulation phase where the prices can trade in a range. This is a natural phenomenon that can occur after a correction from an all-time High. Technical indicators suggest a long-term bullish outlook with a sideways to bearish short-term. Swing Traders can capitalize on the current situation meanwhile long-term investors might have to wait.
Technical levels
Support Levels: $179.51- Support 1
$175.65- Support 2
Current Price: $183.58
Resistance Levels: $186.81
Disclaimer
In this article, the views and opinions stated by the author, or any people named are for informational purposes only, and they don’t establish investment, financial, or any other advice. Trading or investing in cryptocurrency assets comes with a risk of financial loss.