
- ROSE is currently trading at $0.04492339, with a rise of 2.25% in 24 hours.
- The live market cap of ROSE is $225873649.
- ROSE dropped by -10.99% in the previous seven days.
Oasis Network (ROSE) is a popular privacy-enabled and scalable layer-1 blockchain network. It combines low gas fees and high throughput with guarde architecture to give a next-generation base for Web3. It will also power DeFi, GameFi, NFTs, Metaverse, Data tokenization, and Data DAOs.
Oasis drives web3 forward, scaling it and evolving it from inception to maturity. Backed by top industry bankers, Oasis declared the $235 million ecosystem fund to support projects built on the network. Oasis Labs, the ecosystem technical contributor, partnered with BMW Group and Meta to develop privacy-protected products and platforms that secure and guard the data.
Trend Analysis
By studying the previous price data, we can say that ROSE is in a downtrend currently. The price declined by -10.99% in the last seven days, and due to this 1INCH is underperforming right now. From its peak price, it fell 92.48% since the previous year and destroyed the investors’ wealth. As we know, the current market sentiments could be better, and there is no significant volume and buyers in the current market condition. It could be a reason for the underperformance of the coin.
Oasis Network Price Analysis
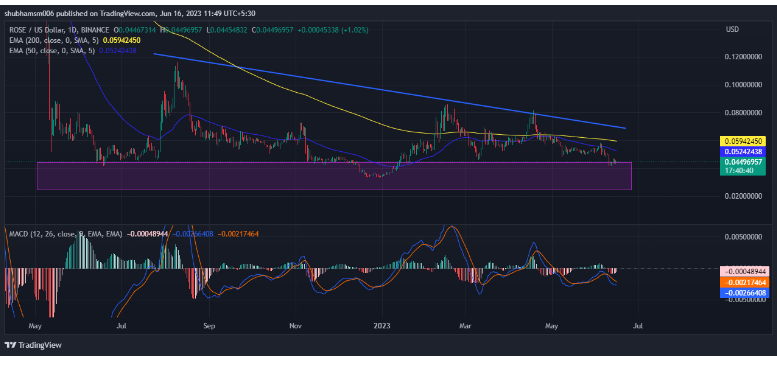
ROSE Price is trading below the 200-day EMA and 50-day EMA on the daily time frame, which is a negative sign. Investors’ sentiments regarding ROSE are negative and are on the selling side because of the lousy performance of ROSE.
The MACD indicator is on the bearish side and gives a bearish signal. The MACD line at -0.00248350 and movement line at -0.00152891 are below the zero line suggesting the MACD is in negative territory and giving bearish signals.
The current value of RSI is 30.80 points, and the 14 SMA line is below the median line, around 43.74 points, showing bearish sentiment in the market. The 14 Day SMA line beneath the median line indicates a bearish trend or bearish sentiment in the market, as the price is currently at an oversold area.
In the Stochastic RSI, the %d line is at 1.09, and the %k line is at 0.00 points. The %d line indicates that RSI is heading toward the overbought zone. On the other hand, the %k line shows neutral sentiments regarding the price.
Technical Levels
- Support – The current support level of ROSE are $0.04 and $0.036.
- Resistance –The current Resistance level of ROSE are $0.061 and $0.069.
Conclusion
ROSE price shows an adverse future due to the conditions mentioned above. Major indicators like EMA, RSI, MACD, and Stochastic RSI show negative signs in the ROSE coin. Investors need to show significant buying interest, which could be happening because of the consistent negative performance of the coin. If the coin breaks the current level, then the chances of the coin falling further may also increase.
Disclaimer
The analysis given above is for informational and educational purposes only. You should not be taken it as financial, investment, or any other trading advice. Investing in or trading crypto assets is risky. Please consider your circumstances and risk profile before making any investment decisions.