
- The trading volume of the token has a huge surge of 440% in the last 24-hours.
- STORJ is currently trading at $0.282 with an intraday rise of 16.2%.
- The token is down from all-time high by 93.03%.
The token has seen an immense inflow in the daily trading volume. The token has increased its value by almost a quarter of its value in a day. All the indicators are showing a bullish movement in the token.
- The market cap of the token is at $10.92M. The market cap saw a surge by 16.25%.
- The total circulating supply of the token currently is 387,445,110 STORJ which is 91.16% of its total supply.
- The trading volume of the token is $16.52M in the last 24 hours.
The token marked its all-time high on 28th March 2021, Where the token was priced at 3.91%.
STORJ has a general event from 18 Sep 2023 to 21 Sep 2023 – Storage Developer Conf. – on this day, the token market can be a little volatile.
SENTIMENT ANALYSIS :
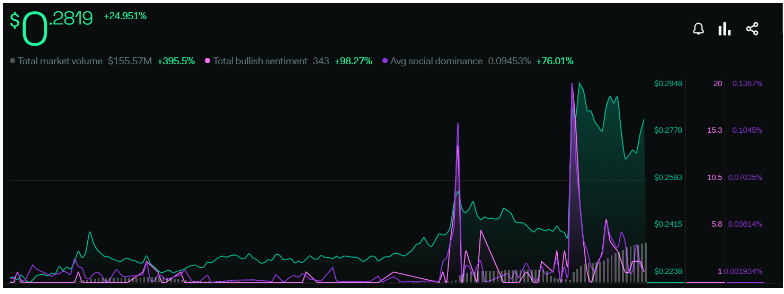
The value of the token has increased by 24.951% in the last 1 week. The total bullish sentiments also surged by 98.27% which shows that the bullish investors are dominating the market. The average social dominance has also increased by 76.01% which shows the community of the token are active and in favor of the bulls.
![]()
The total bearish sentiment has also increased by 521.4% as the price is currently declining from the resistance of $0.295. Which can bring the price again in a downtrend and we will fall to $0.22 range.
TECHNICAL ANALYSIS ( DAILY – 1D )
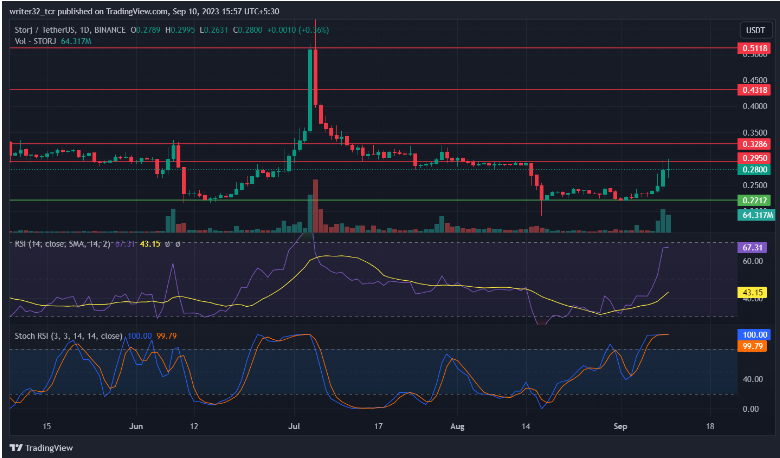
As we can see in the chart, The token took support from the $0.22 range and started moving upwards and currently the price is trading at $0.28. Also, we are declining from the resistance of $0.295. If the price breaks this resistance then the next resistance is at $0.328 breaking this resistance we can see a rally to the level to $0.43 easily.
However, If the price rejects from the $0.295 resistance we can fall again to $0.22 or further. If we break this support, the next support is at $0.19
The RSI is indicating a bullish signal as the price is above the neutral levels and moving upwards towards the bullish buying region. The RSI is currently moving at 67.31 points.
The SMA 14 is moving at 43.15 points. The RSI is indicating a positive move.
The Stoch RSI is also indicating the bullish move working in favor with the regular RSI by moving towards the bullish buying region.
CONCLUSION :
The last daily candle closing will decide the further trend of the token. If the candle closes above the resistance level of $0.295 then we will continue the bullish trend. If the price gets rejected from the resistance then we can fall to the $0.22 range.
TECHNICAL LEVELS :
SUPPORT – $0.22 AND $0.19
RESISTANCE – $0.295, $0.238, $0.431 AND $0.511
Disclaimer
The views and opinions stated by the author, or any people named in this article, are for informational purposes only and do not establish financial, investment, or other advice. Investing in or trading crypto assets comes with a risk of financial loss.