

- SYSCOIN Price Prediction Provides a closer look at the strong downtrend SYS Token is trading in.
- SYS Price is creating a falling wedge that may flip the market sentiments.
- SYS Crypto saw a fall of 20.72% in the last 3 months.
SYSCOIN Price Prediction unravels the hardships of investors who are struggling with the falling prices since February. SYS Crypto is trading at $0.1274. The Market is up 1.69% in the last 24H. The 24H volume witnessed a surge of 57.61%. The overall market cap of SYS Token is $95,087,026.
SYSCOIN Rolled out its EVM-L2 Scaling platform Rollux on the 28th June. Rollux is a platform which has the security of Bitcon’s mining network along with Syscoin’s Layer 1 finality and data availability. Rollux acts as Syscoin’s layer 2 which will offer high scalability for a wide variety of use cases which will help mass adaptations. .
SYSCOIN Price Prediction: Falling wedge may flip the momentum
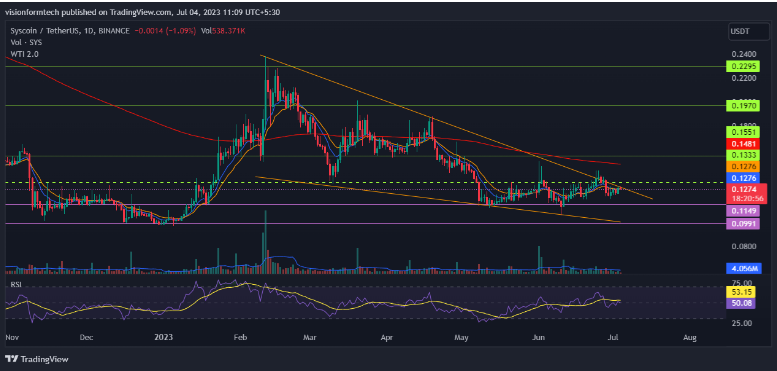
The daily chart concludes that SYS token is in a bear market. SYS price began the year with a bullish rally of 125% from its all-time low to the price of $0.2315. Things turned upside down as the market was unable to go higher. SYS Crypto fell by almost 43% since February
SYSCOIN Price Prediction uncovers a formation of a falling wedge pattern that could change the game. A breakout may ignite a bullish rally of almost 75% to its resistance of $0.235. At present, SYS Coin is trying to sustain above the support of $0.1149. A breach of this level may send the prices down to test the all-time lows.
A struggle to break resistance : Technicals
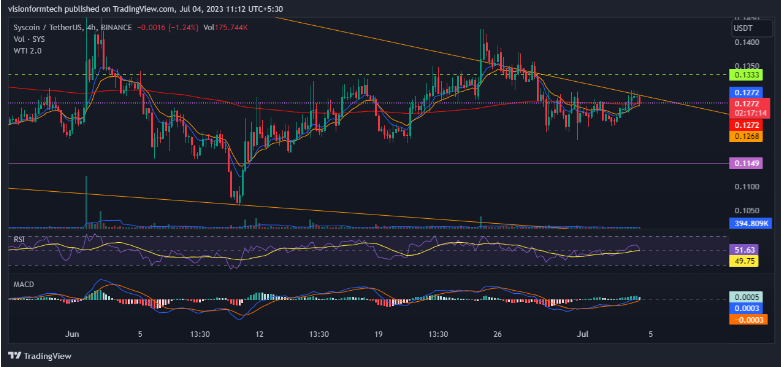
Navigating the 4H Charts unveils a phase of consolidation for SYS Token. Market is moving sideways between support & resistance. The Prices are trapped in a range bound market. Investors are becoming impatient as the prices crawl near its bottom. SYS Coin is very close to the resistance of falling wedge.
The Bulls may try for a breakout but it won’t be easy due to the presence of extreme sell pressure. Technical indicators are supporting the sideways price action with missing momentum. SYS Coin will have to break the local resistance of $0.1369 in order to confirm a break of the falling wedge.
RSI
The RSI indicator is currently at 49.75 on the 4H. It conveys that the market lacks momentum and may move sideways in the short-term.
MACD
MACD did make a bullish crossover . However, the indicator is below the 0 line and the histogram bars are small . This signals at a slow sideways market.
200 EMA
As observed, on the 4hr, the price barely crossed the 200 EMA. It would be better to wait for the prices to move away from the indicator to establish a strong trend. The present market condition is sideways
Conclusion
SYSCOIN Price Prediction unravels the hardships of investors who are struggling with the falling prices since February. The market lacks news buyers and strength. Prices are closer to all time lows which is scary but also an opportunity for some. The Current levels may offer a decent risk-to-reward but only to those who are willing to gamble with calculated risks.
Technical levels
Support Levels: $0.1149 – Support 1
$0.1000- Support 2
Current Price: $0.1274
Resistance Levels: $0.1369 – Resistance 1
$0.1551 – Resistance 2
Disclaimer
The views and opinions stated by the author, or any people named in this article, are for informational purposes only and do not establish financial, investment, or other advice. Investing in or trading crypto assets comes with a risk of financial loss.