

- Theta Network(THETA) is currently trading at $0.72729000.
- Theta Network(THETA) live market cap is $724,763,389.
- Theta Network(THETA) price trades below the 20 and 50-day EMA.
A decentralized blockchain network, Theta, seeks to revolutionize the video streaming market by enhancing content delivery and cutting prices. Theta (THETA), the native cryptocurrency of the network, is used to reward users for sharing their unused bandwidth and computing resources. The network runs on a proof-of-stake consensus process.
Trend Analysis
Theta price prediction has been persistently downward daily, leading to a substantial decrease that reached an all-time low two weeks ago. After getting this down, the price began to consolidate, appearing to find some stability before experiencing a clear bounce. Theta has, however, suffered a significant decline of about 95% since its initial listing, illustrating the negative market mood.
On the price chart for Theta, there are conflicting signals right now. One way to look at it is that the recent comeback has given some positive momentum, which has caused the 20-day Exponential Moving Average (EMA) to cross. It is crucial to remember that despite this development, the price is still below the 50-day EMA, indicating that negative pressure is still present.
Due to these conflicting indications, Theta overall outlook appears to be ambiguous, making it difficult for traders and investors to predict where it will go in the future. Given the current uncertainty, it could be wise to proceed cautiously and wait for a more distinct trend to develop before making any substantial trading choices. If the price activity is attentively watched, it is possible to gain further insight into whether Theta will resume its downward trend or turn around and start moving in the opposite direction.
Theta Network(THETA) Price Prediction
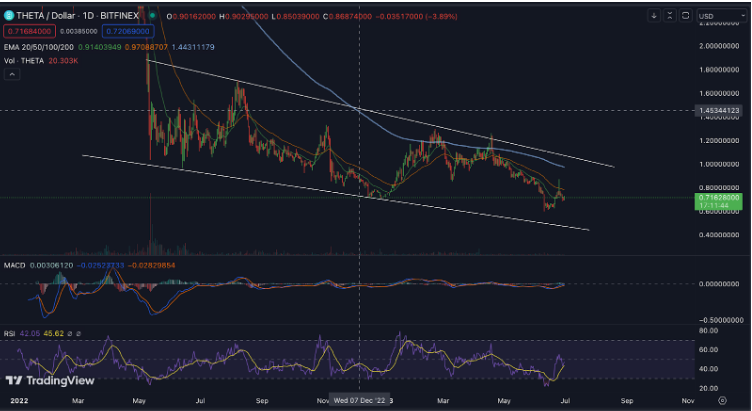
The MACD indicator has created a green histogram on the daily timescale, and the MACD line is now above the signal line, pointing to a short-term bullish momentum. This positive MACD configuration points to a potential asset price increase.
Additionally, we notice that the price still needs to be overbought when analyzing the Relative Strength Index (RSI). The price may need to reach the overbought area, which usually comes before the arrival of selling pressure, to finish its cycle. The RSI line gives a favorable signal, pointing to a probable price increase because it recently left the oversold area.
The Exponential Moving Average (EMA) lends support for a bullish trend. A resuming bullish trend is indicated by the price’s recent crossing over the 20-day EMA and its approach to the 50-day EMA. The possibility of an upward price movement shortly is increased by this EMA arrangement.
Considering these elements, the combined signals from the MACD, RSI, and EMA indicators present a favorable picture for the asset, indicating a likely upward trajectory in the price shortly.
Conclusion
Theta price prediction has effectively reversed from its record low, signaling a price rise, in conclusion. There is a chance of further price growth if it can hold at its current level. Indicators point to Theta moving favorably. However, as there are conflicting signs, it is wise to wait for confirmation.
Technical Levels
Support – $0.45929032.
Resistance -$1.0388584.
Disclaimer
The thoughts and THETAinions expressed by the author or anyone else named in this article are solely for informational purposes. They don’t offer any advice, be it financial, investment, or otherwise. The possibility of losing money exists when buying, selling, or investing in cryptocurrencies.