

WAXP is trading at very critical support and in an important demand zone. The last time the price was in this zone, the bulls managed to push the price up by almost 110 %.
- WAXP/USDT is up 0.72% today
- WAXP/USDT is trading near its all-time
WAXP/USDT is trading at $0.0420 after taking a decent bounce from its daily support level of $0.0399. This zone is very important as it is the last line of defense for the Bulls. Any break below this level will send this asset into uncharted territory which might cause a severe downfall.
The Daily chart shows price might create a potential double bottom
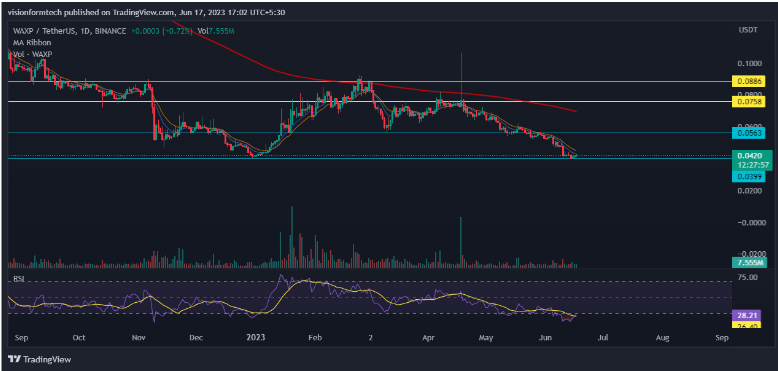
According to the daily chart, the overall trend is bearish. This can be made out by looking at the market structure where the price is creating lower lows. The Price is trading 40% below the 200 EMA. If we look at the bigger picture, we can see that the price could form a potential double bottom. Also, current price levels offer an excellent risk-to-reward ratio.
The price is trading at an all-time low and investors can set a stop loss just below the all-time low which is a risk of just 5% and the upside potential is very high. The RSI is also about to cross with the MA indicating that the sellers must be getting exhausted.
The 4H chart shows a bullish divergence on RSI
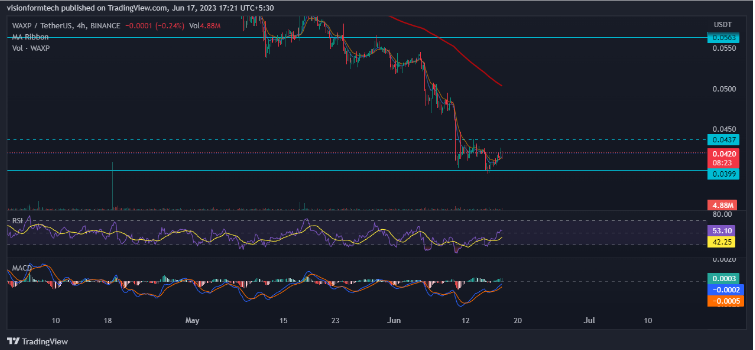
On the 4H Chart, the price action is showing a bearish scenario, where the price is formking lower lows. If we observe closely, we can observe the RSI is showing a bullish divergence. The price created a lower low, meanwhile, the RSI created a higher low. This highlights the diminishing strength of bears.
Bulls must closely observe the level of $0.0433. This is a local resistance level in the short term. A break above this level can signal further bullish movements and also a potential trend reversal. The next hurdle for the bulls at $0.0520. But the investors should keep in mind that the trend is bearish and the chances of downfall are still high.
RSI
The RSI indicator is currently at 51.89 and the RSI has crossed the MA line towards the upside. This is a sign of bullish to sideways market condition.
MACD
The MACD indicator made a bullish crossover. The MACD is still below the 0 lines indicating that the market is still bearish.
200 EMA
As observed, on the 4hr, the price is trading below the 200 EMA(exponential moving average) which acts as a significant resistance. This is a clear indication of a downtrend where the sellers are in control and for a trend reversal, the price must break and trade above the 200 EMA.
Technical levels
Support Levels: $0.0399
Current Price: $0.548
Resistance Levels: $0.0435 – Resistance 1
$0.0520 – Resistance 2
Conclusion
WAXP is in a strong bear trend and the price action is suggesting that there is a high probability of further downfall. The bears need to watch the support level of $0.0399 in case of a breakdown. This event may trigger panic selling and the price may start to fall quickly. Since the price is on daily support, there is also a probability of reversal. With a very high risk to reward. To Conclude, investors must be vigilant as the market is in a key area of interest and also properly follow proper risk management.